Roles: Research / organisation / information architecture / ideation / layout and design /
content creation
content creation
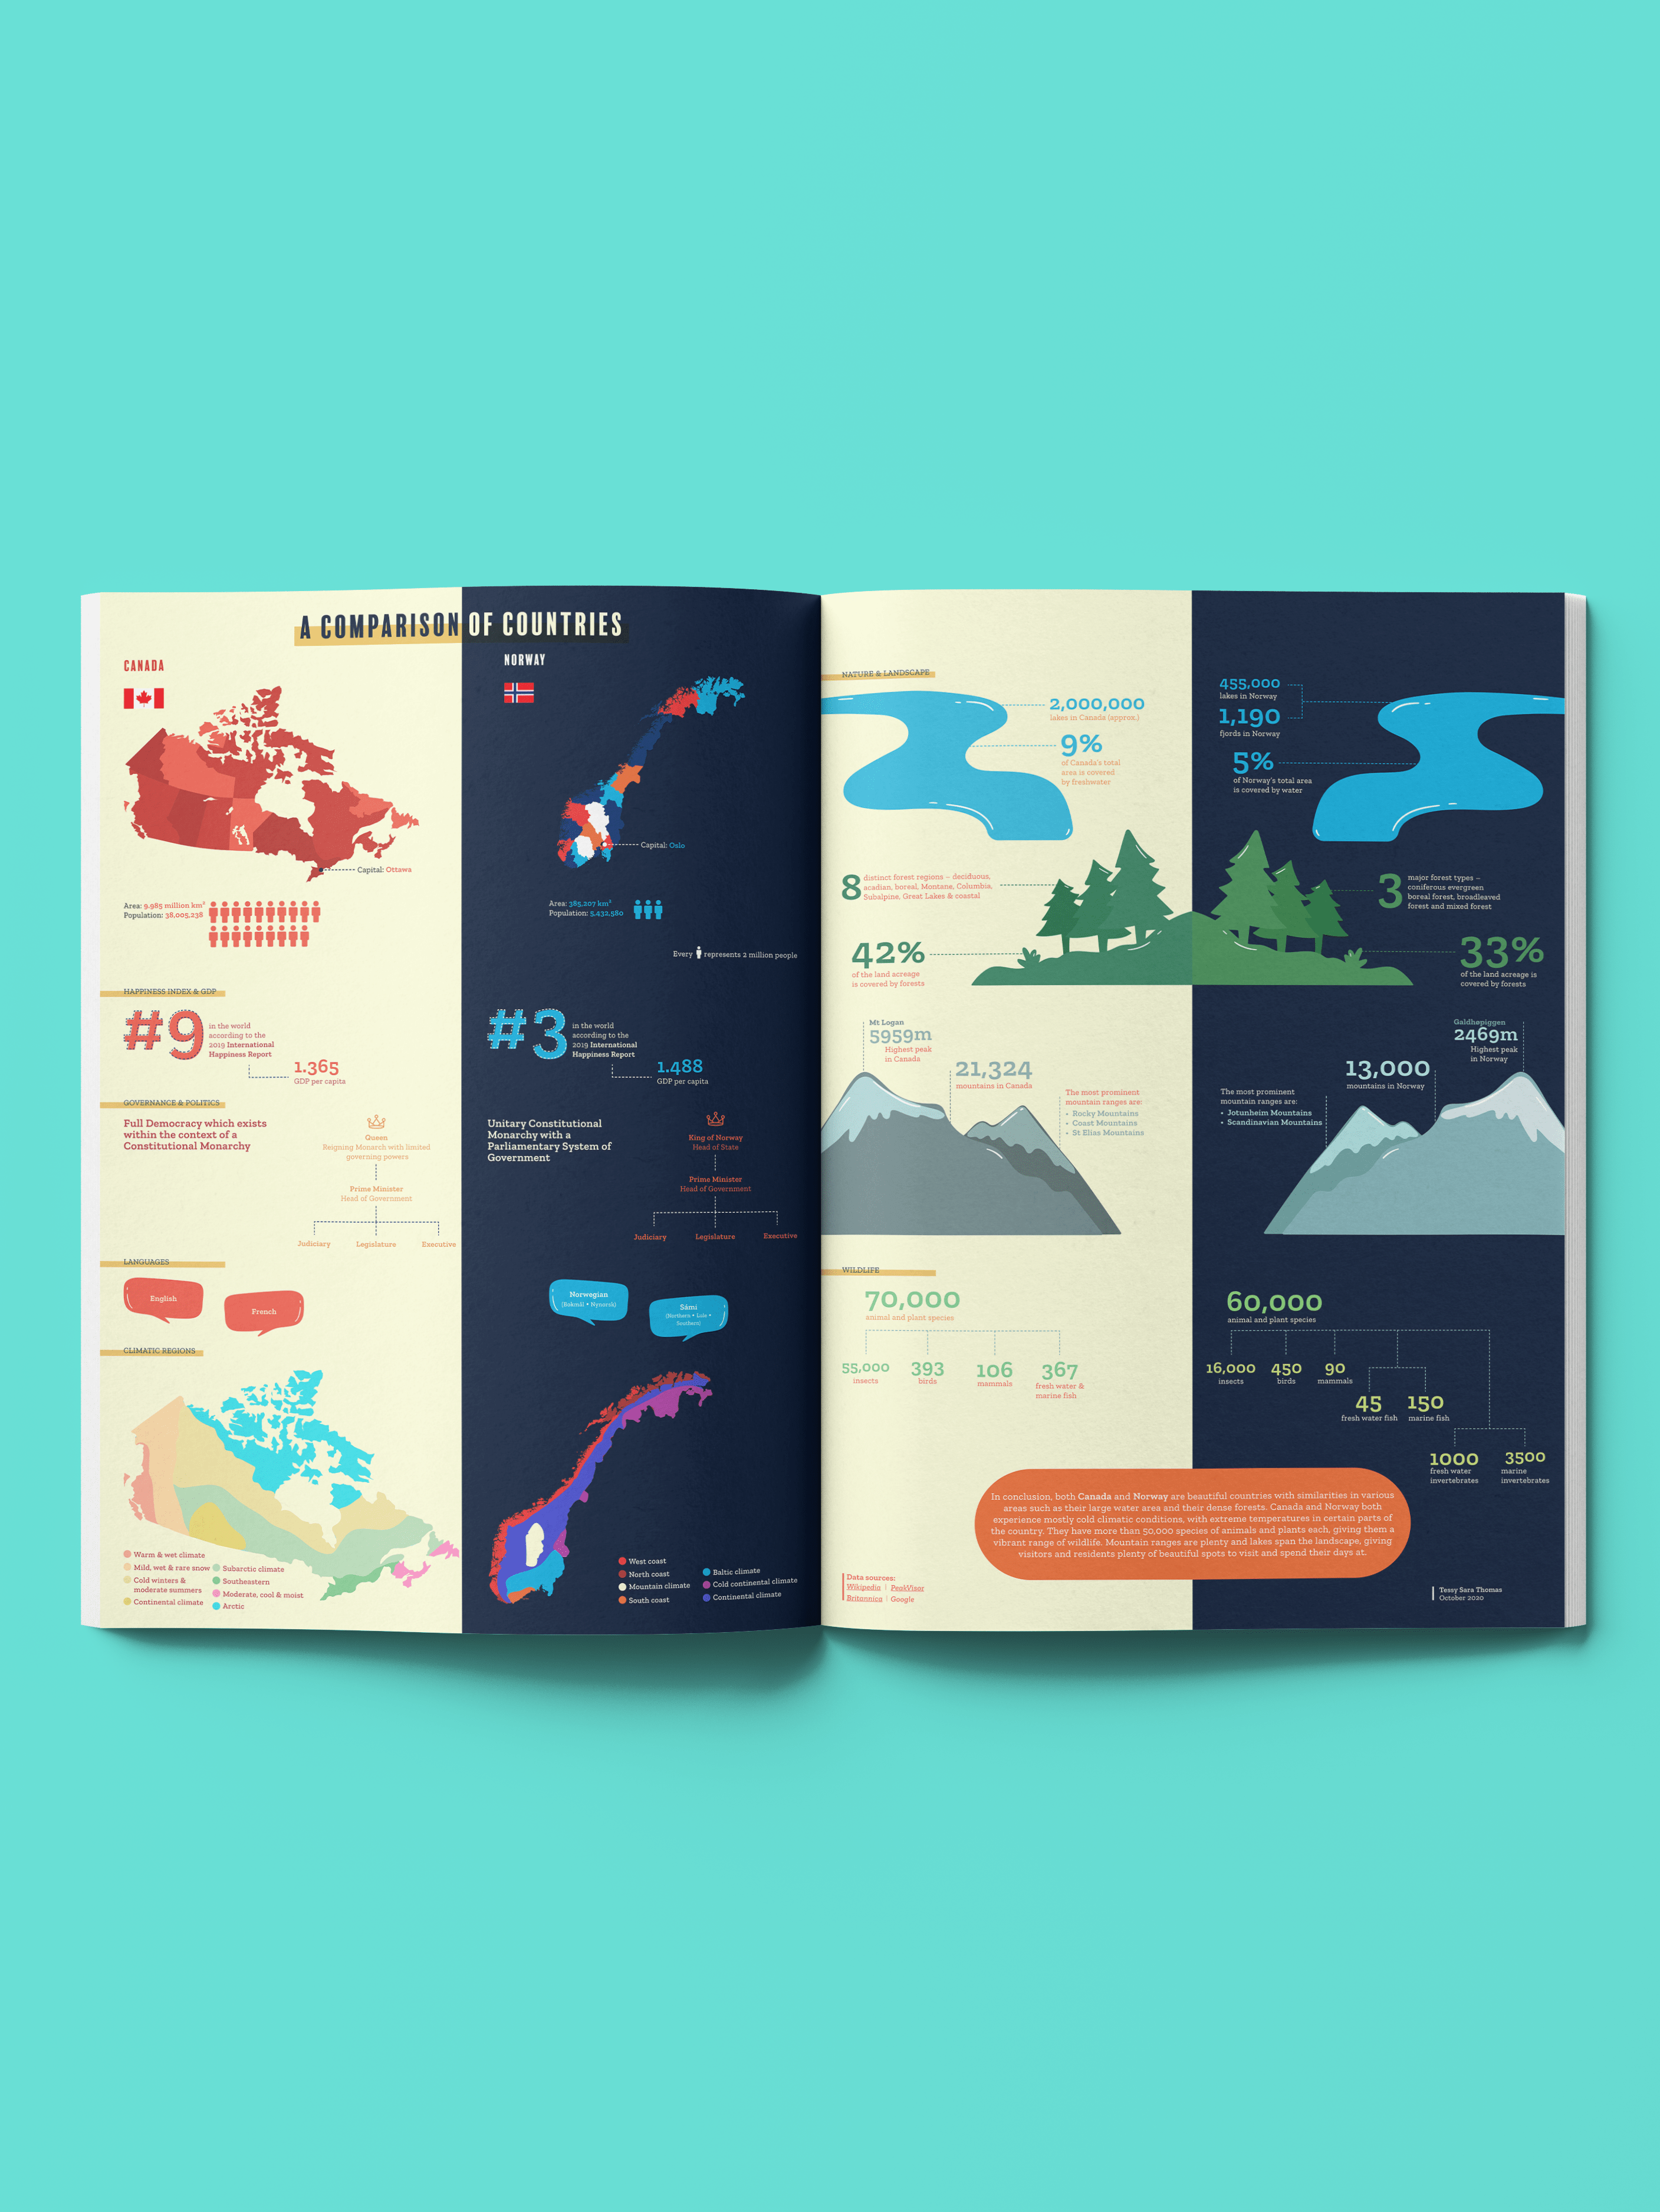
As part of a class on Information Visualisation, I had to design an infographic which categorised and presented my day-to-day activities over the course of a week. The process of designing this infographic involved several steps such as recording and sorting information, ideating the visual representation of the information and layout design.
Since lockdown has been a weird time for all of us, the creation of this infographic provided a lot of insight as to how I spent my time and gave me a new outlook on how to increase productivity and prioritise. Through this process, I also gauged the importance of infographic design and how to arrange information with the help of visual elements to make it more comprehensible.
The final infographic was extremely exciting to work on, and allowed me to draw insights from my own activities.
Thank you. Hope you enjoyed this project!