Objective
To design an infographic that would visually depict and analyse two countries — which are either very similar to or very different from each other.
Project Description
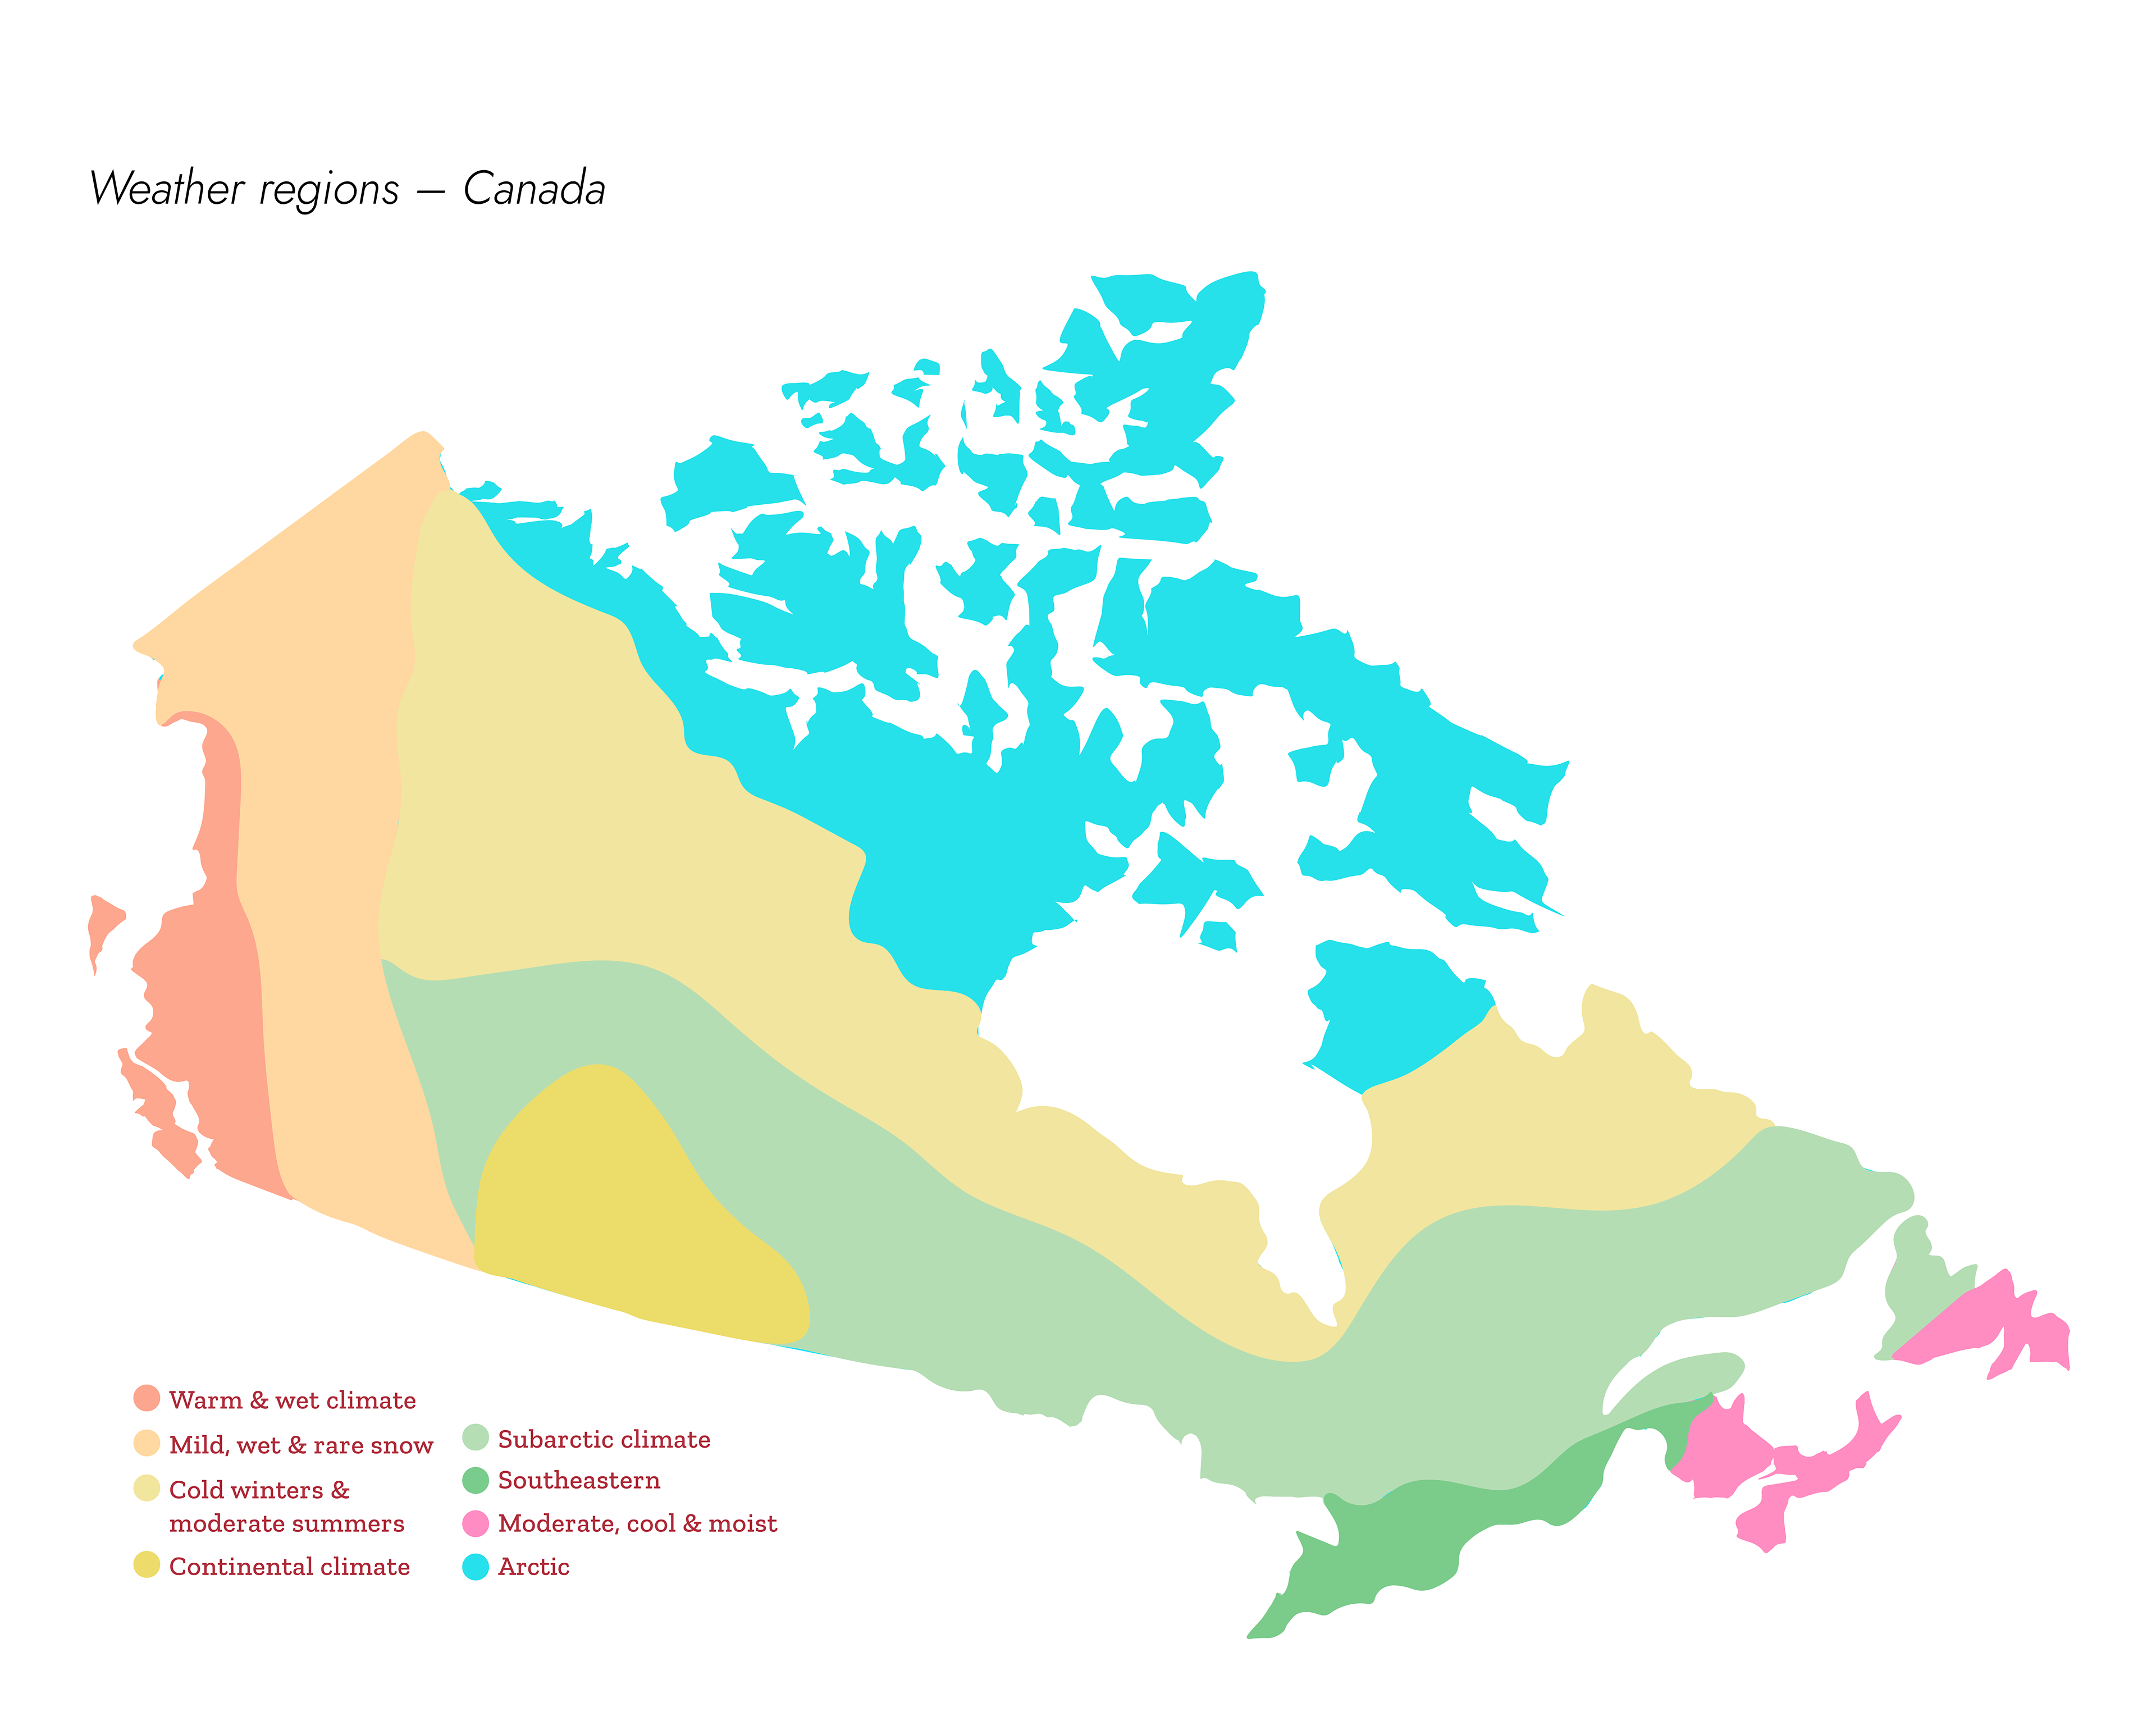
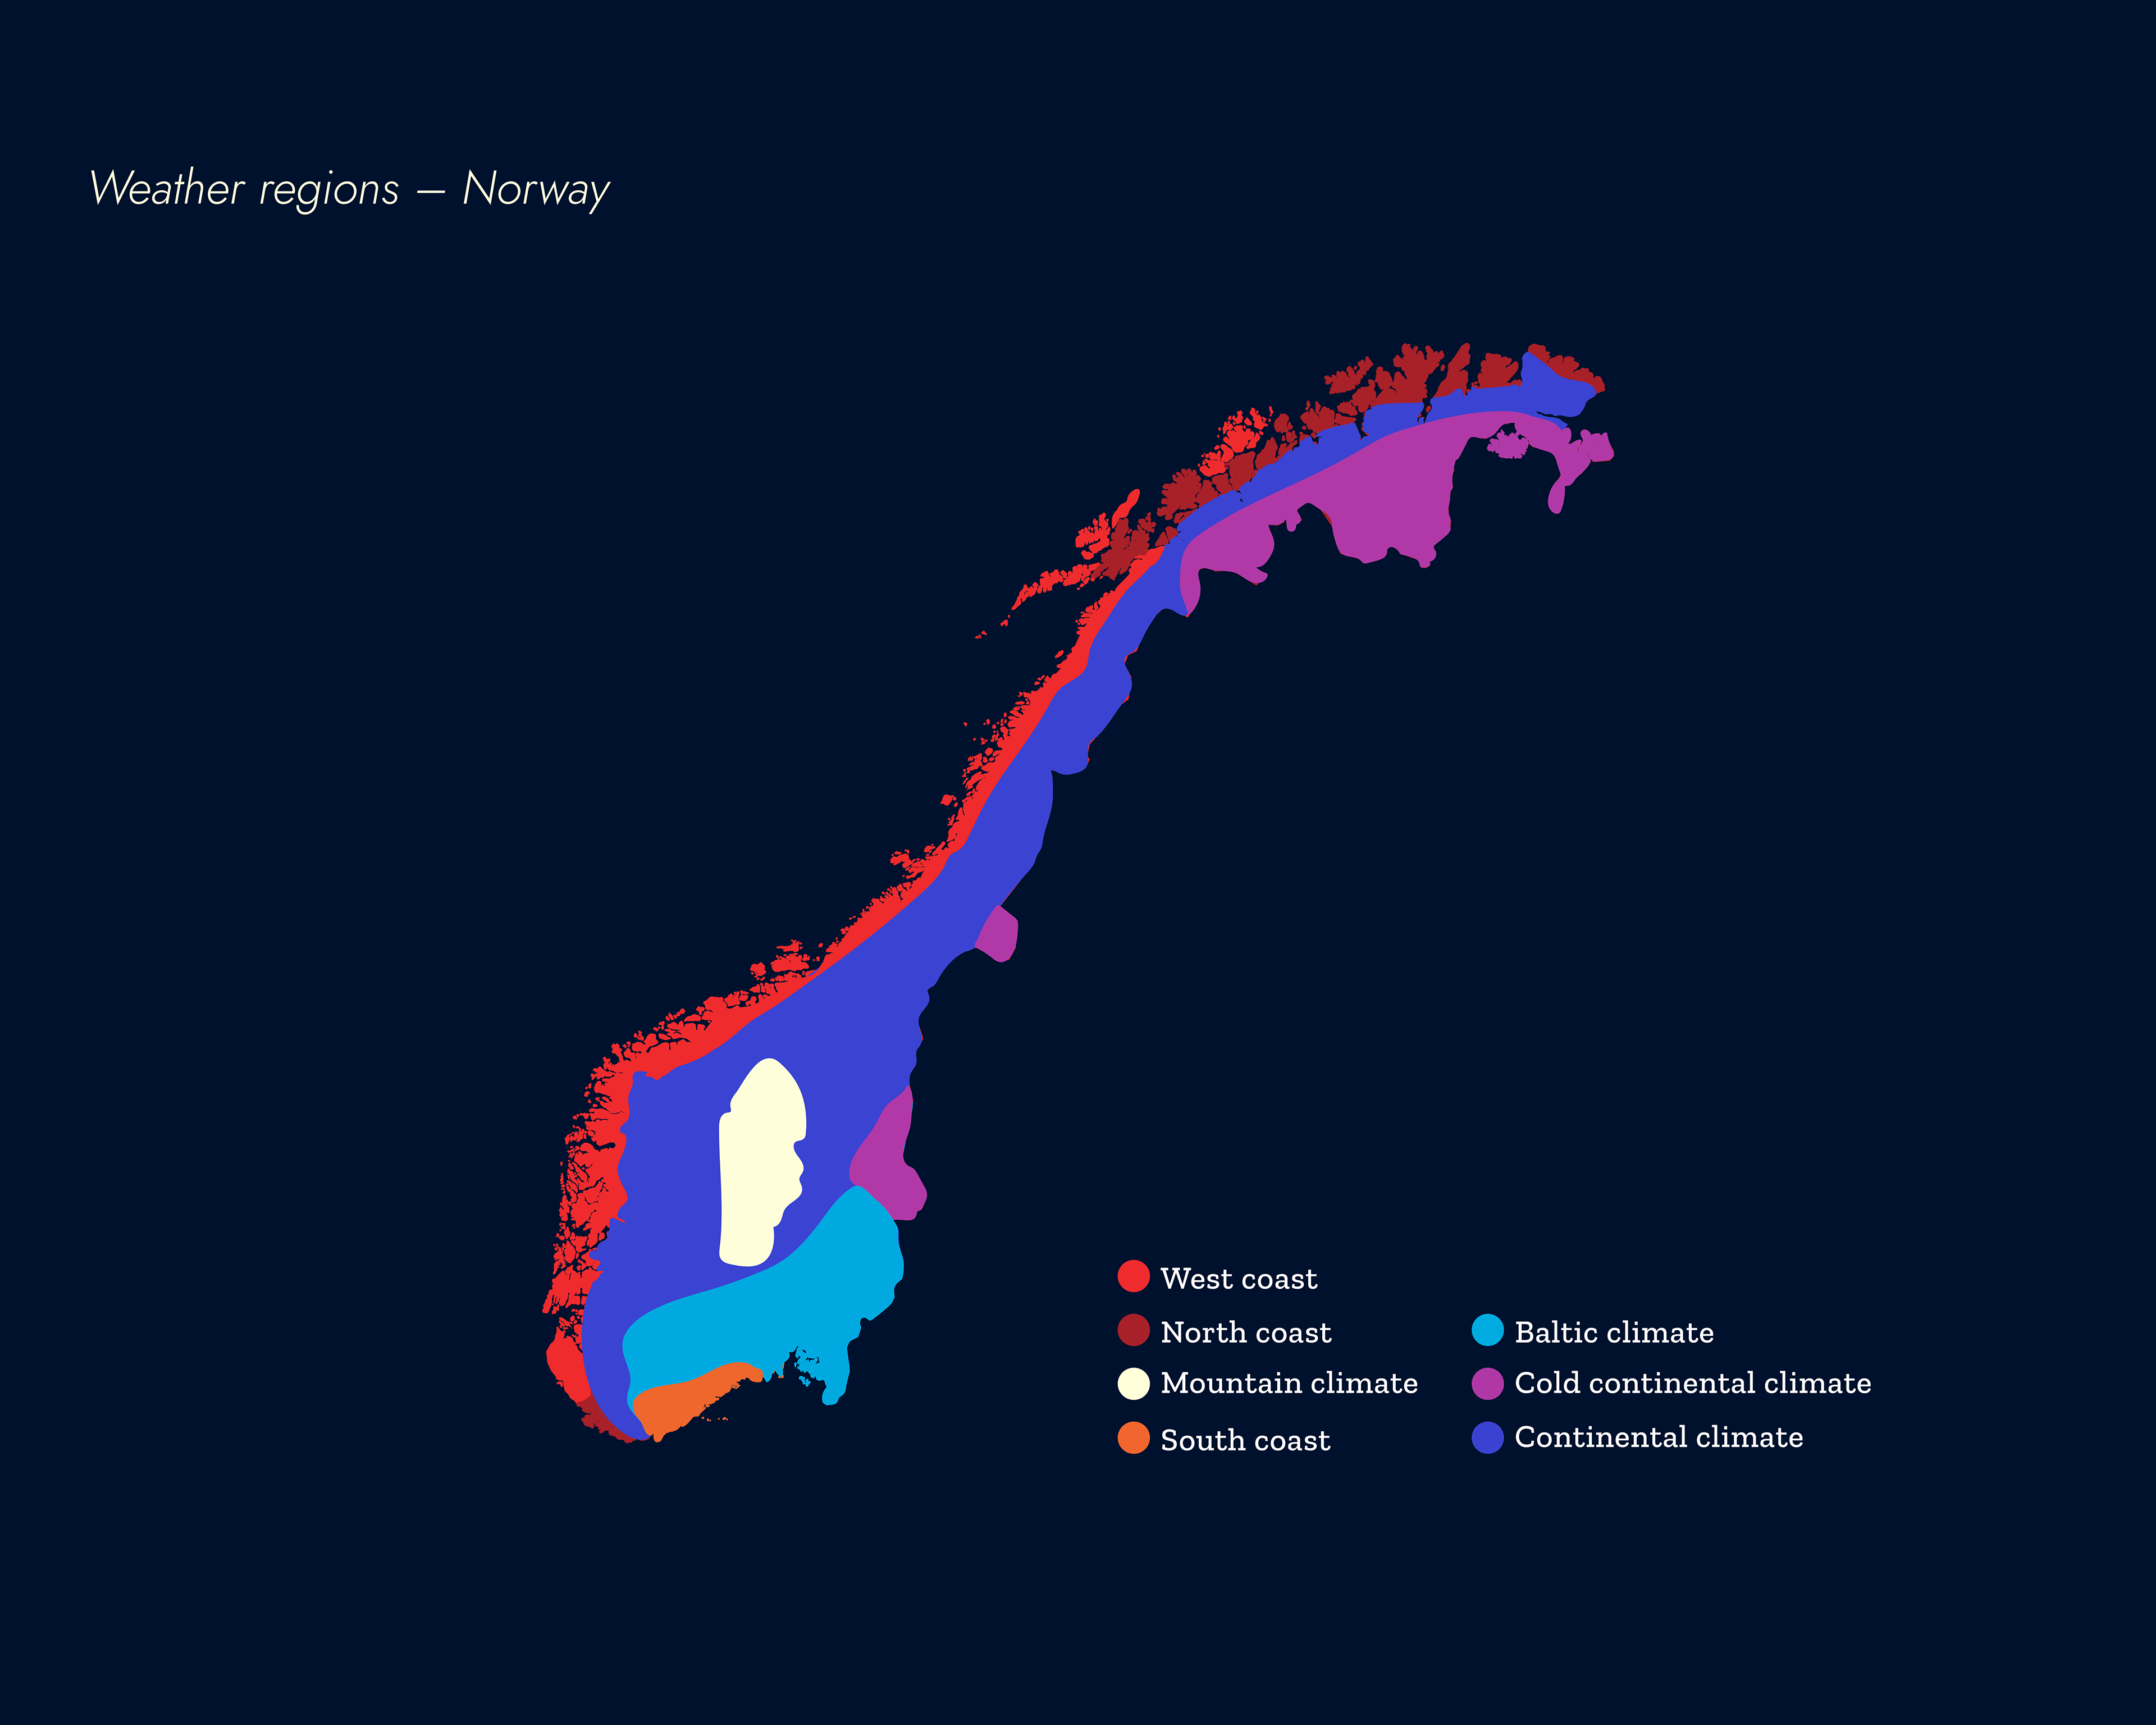
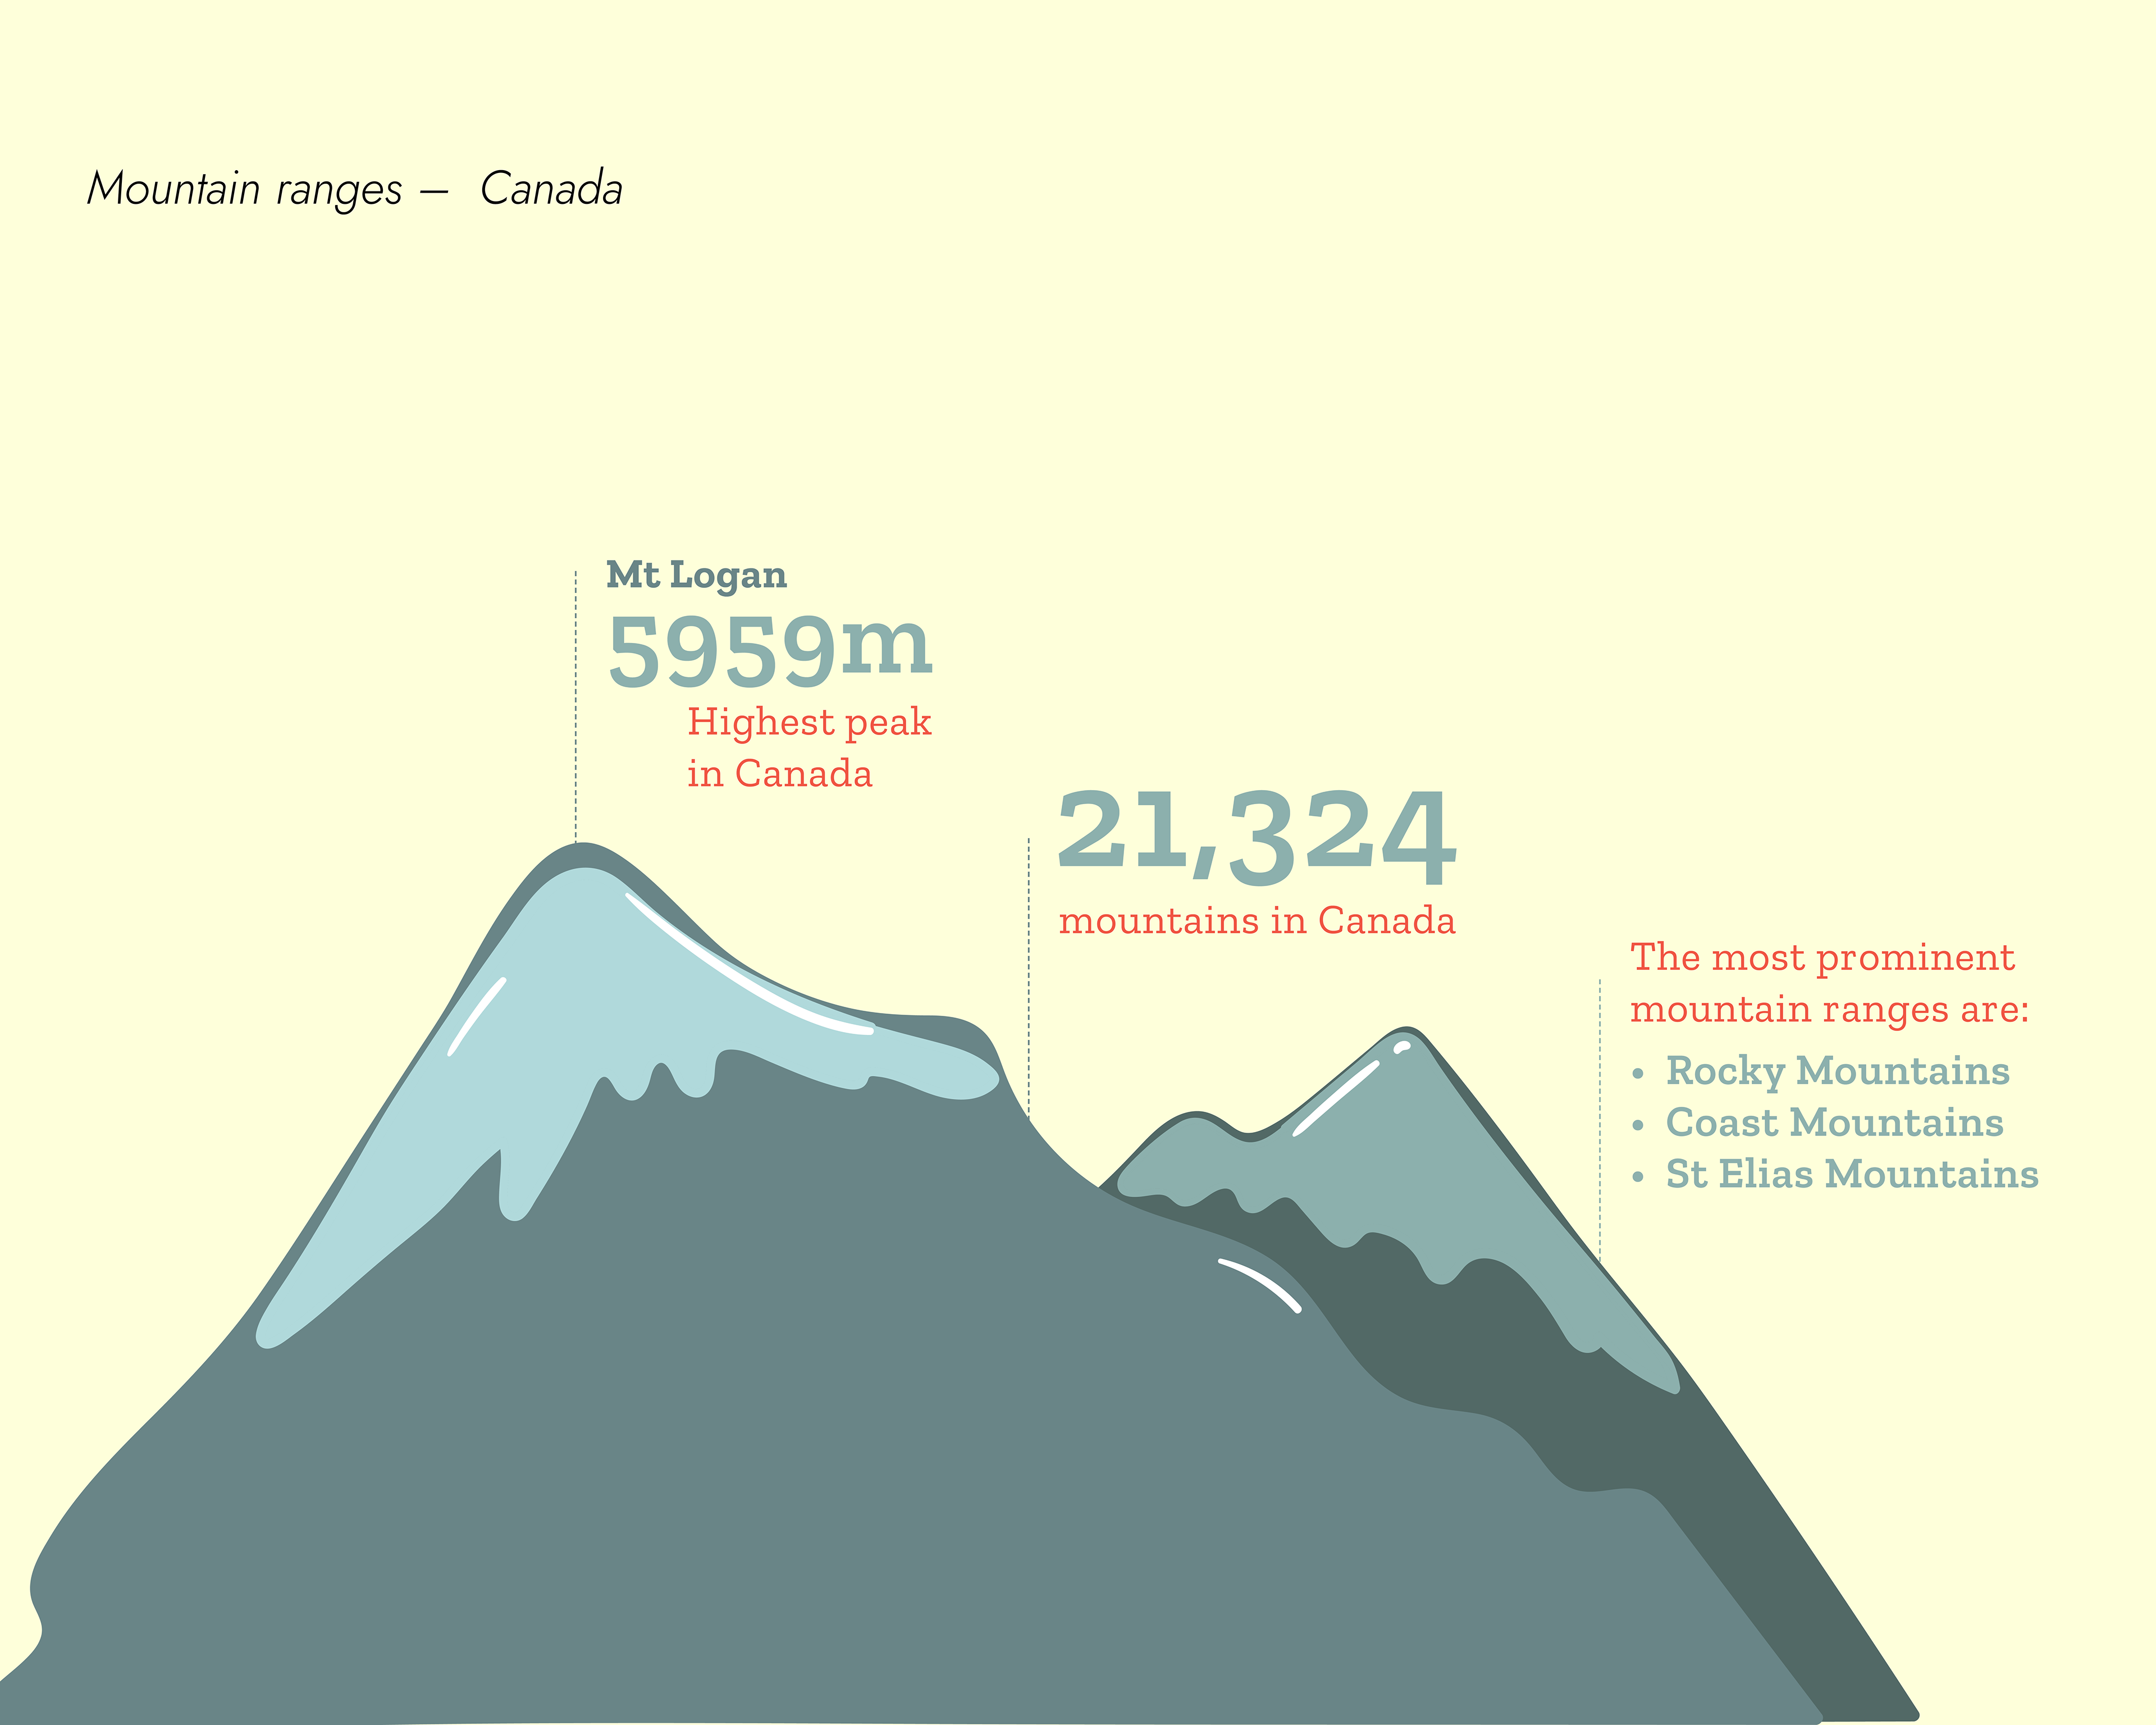
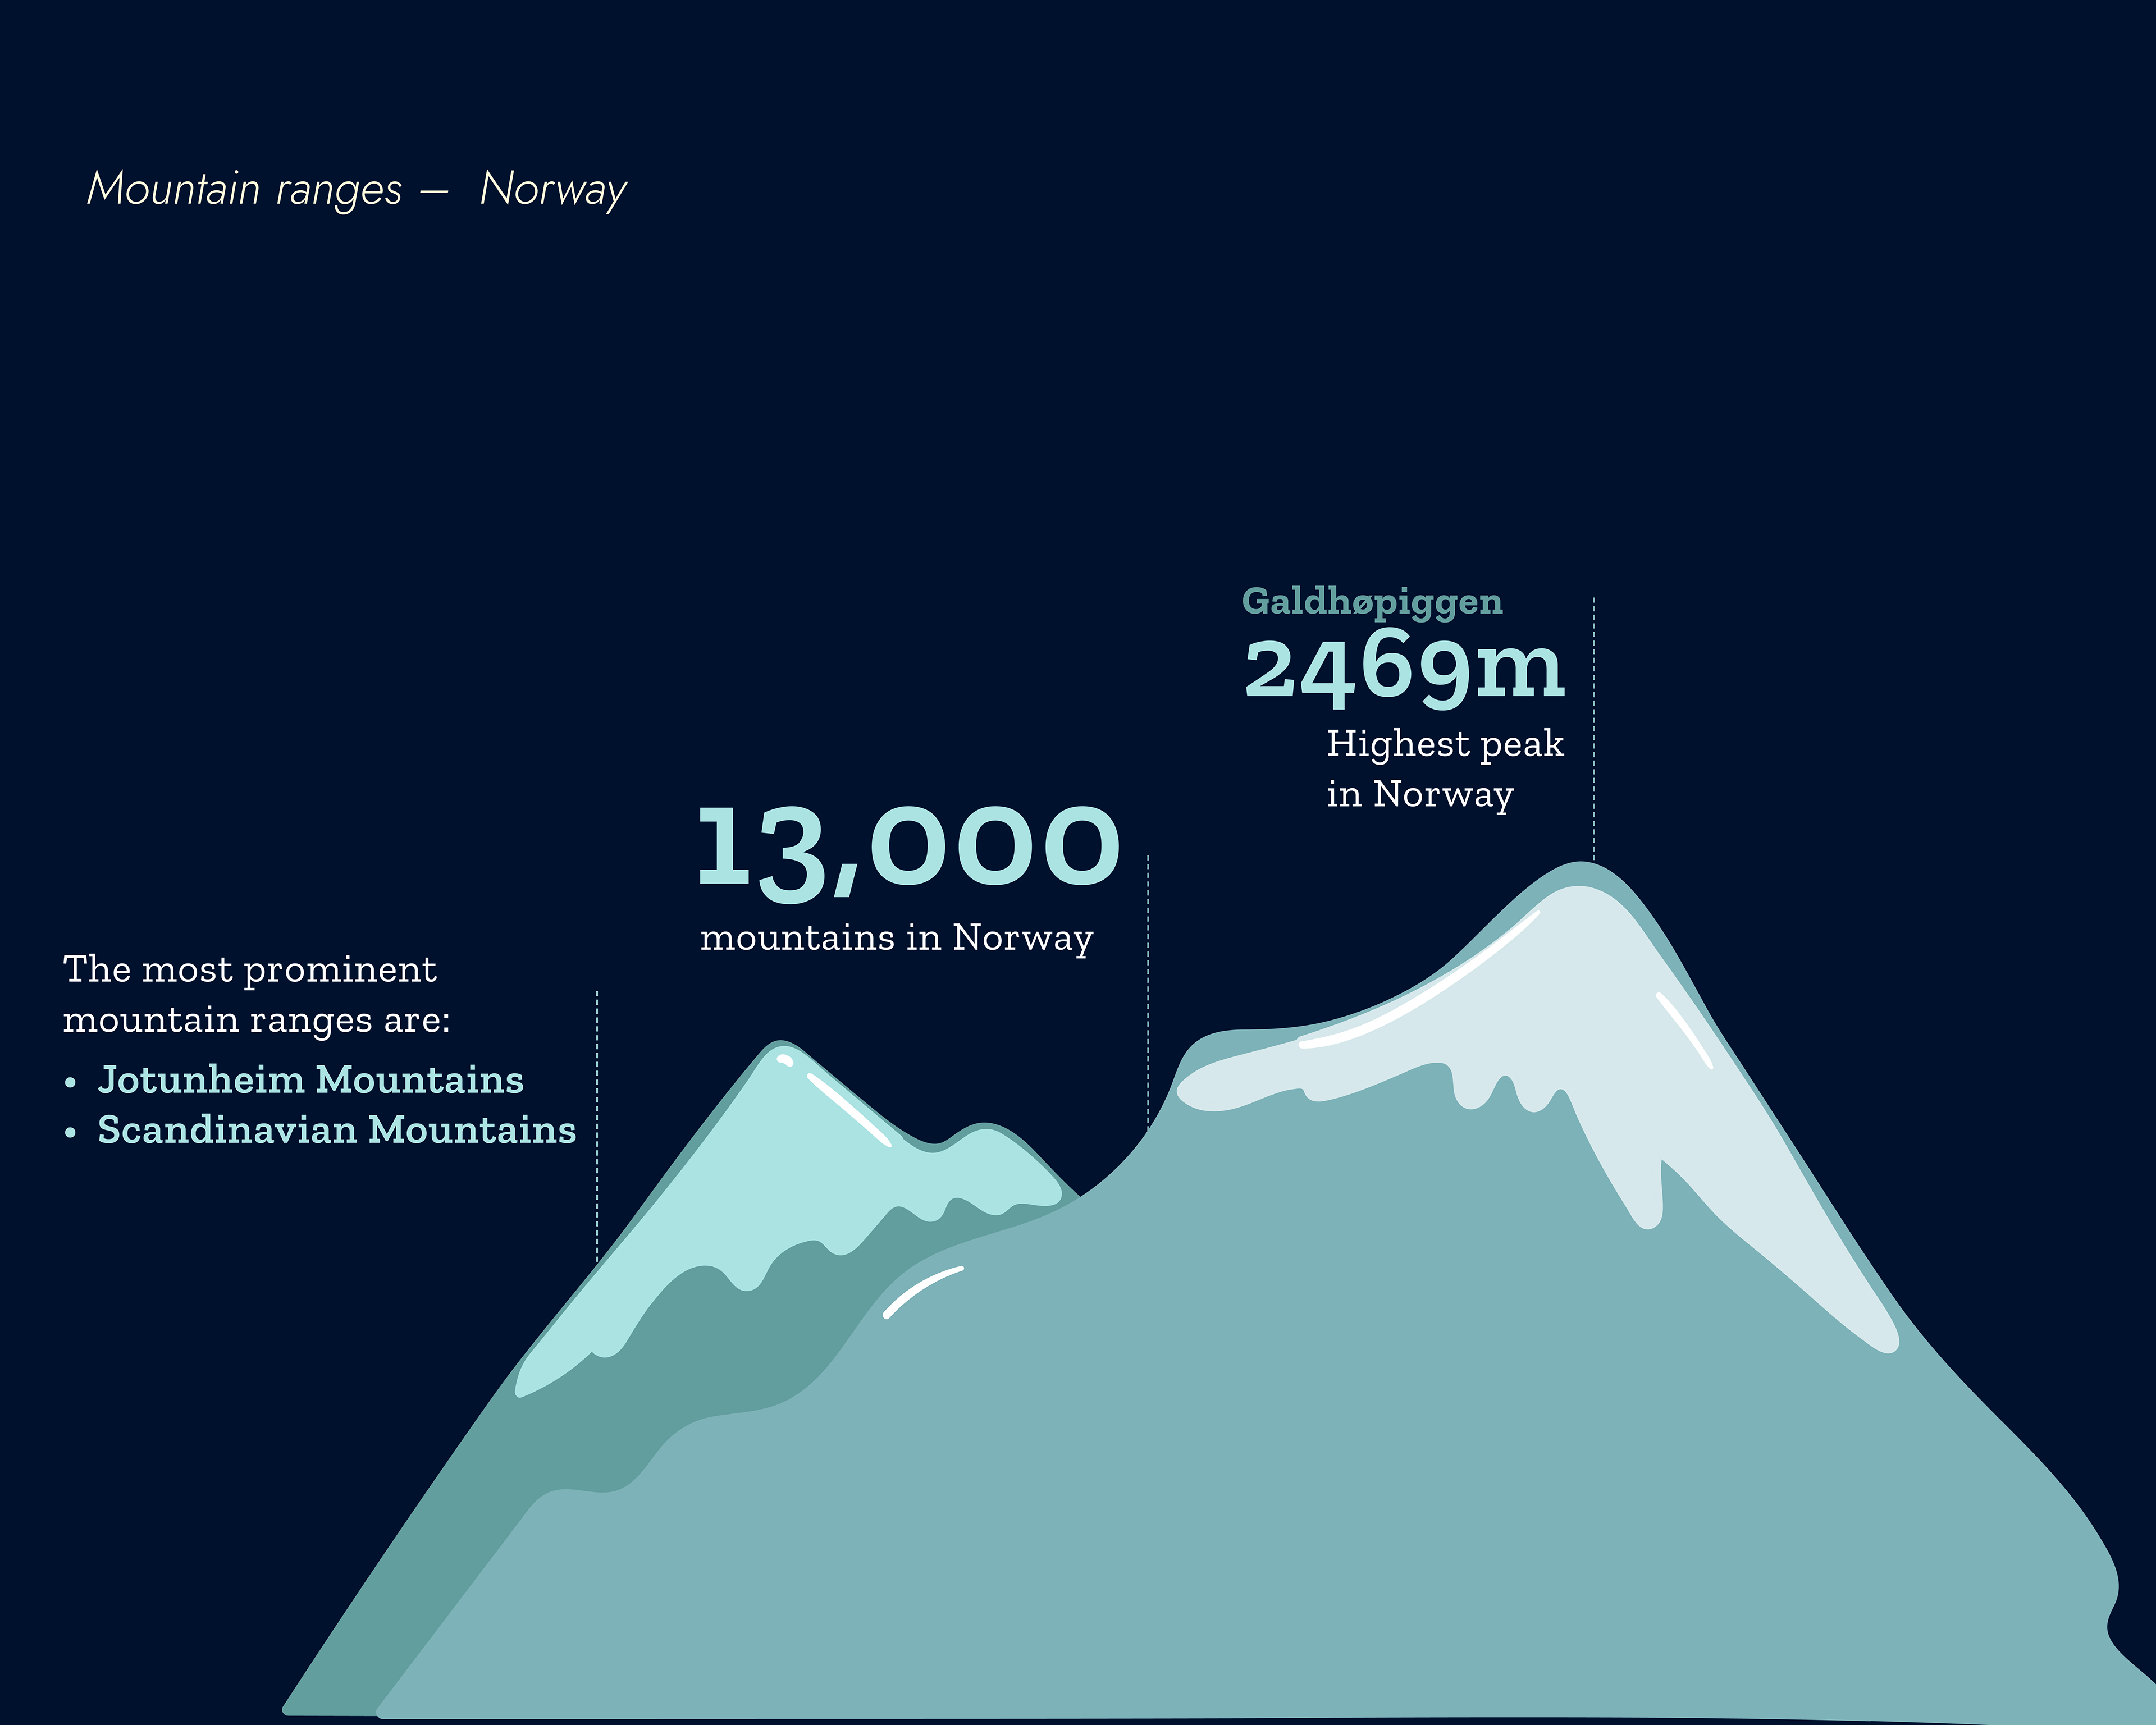
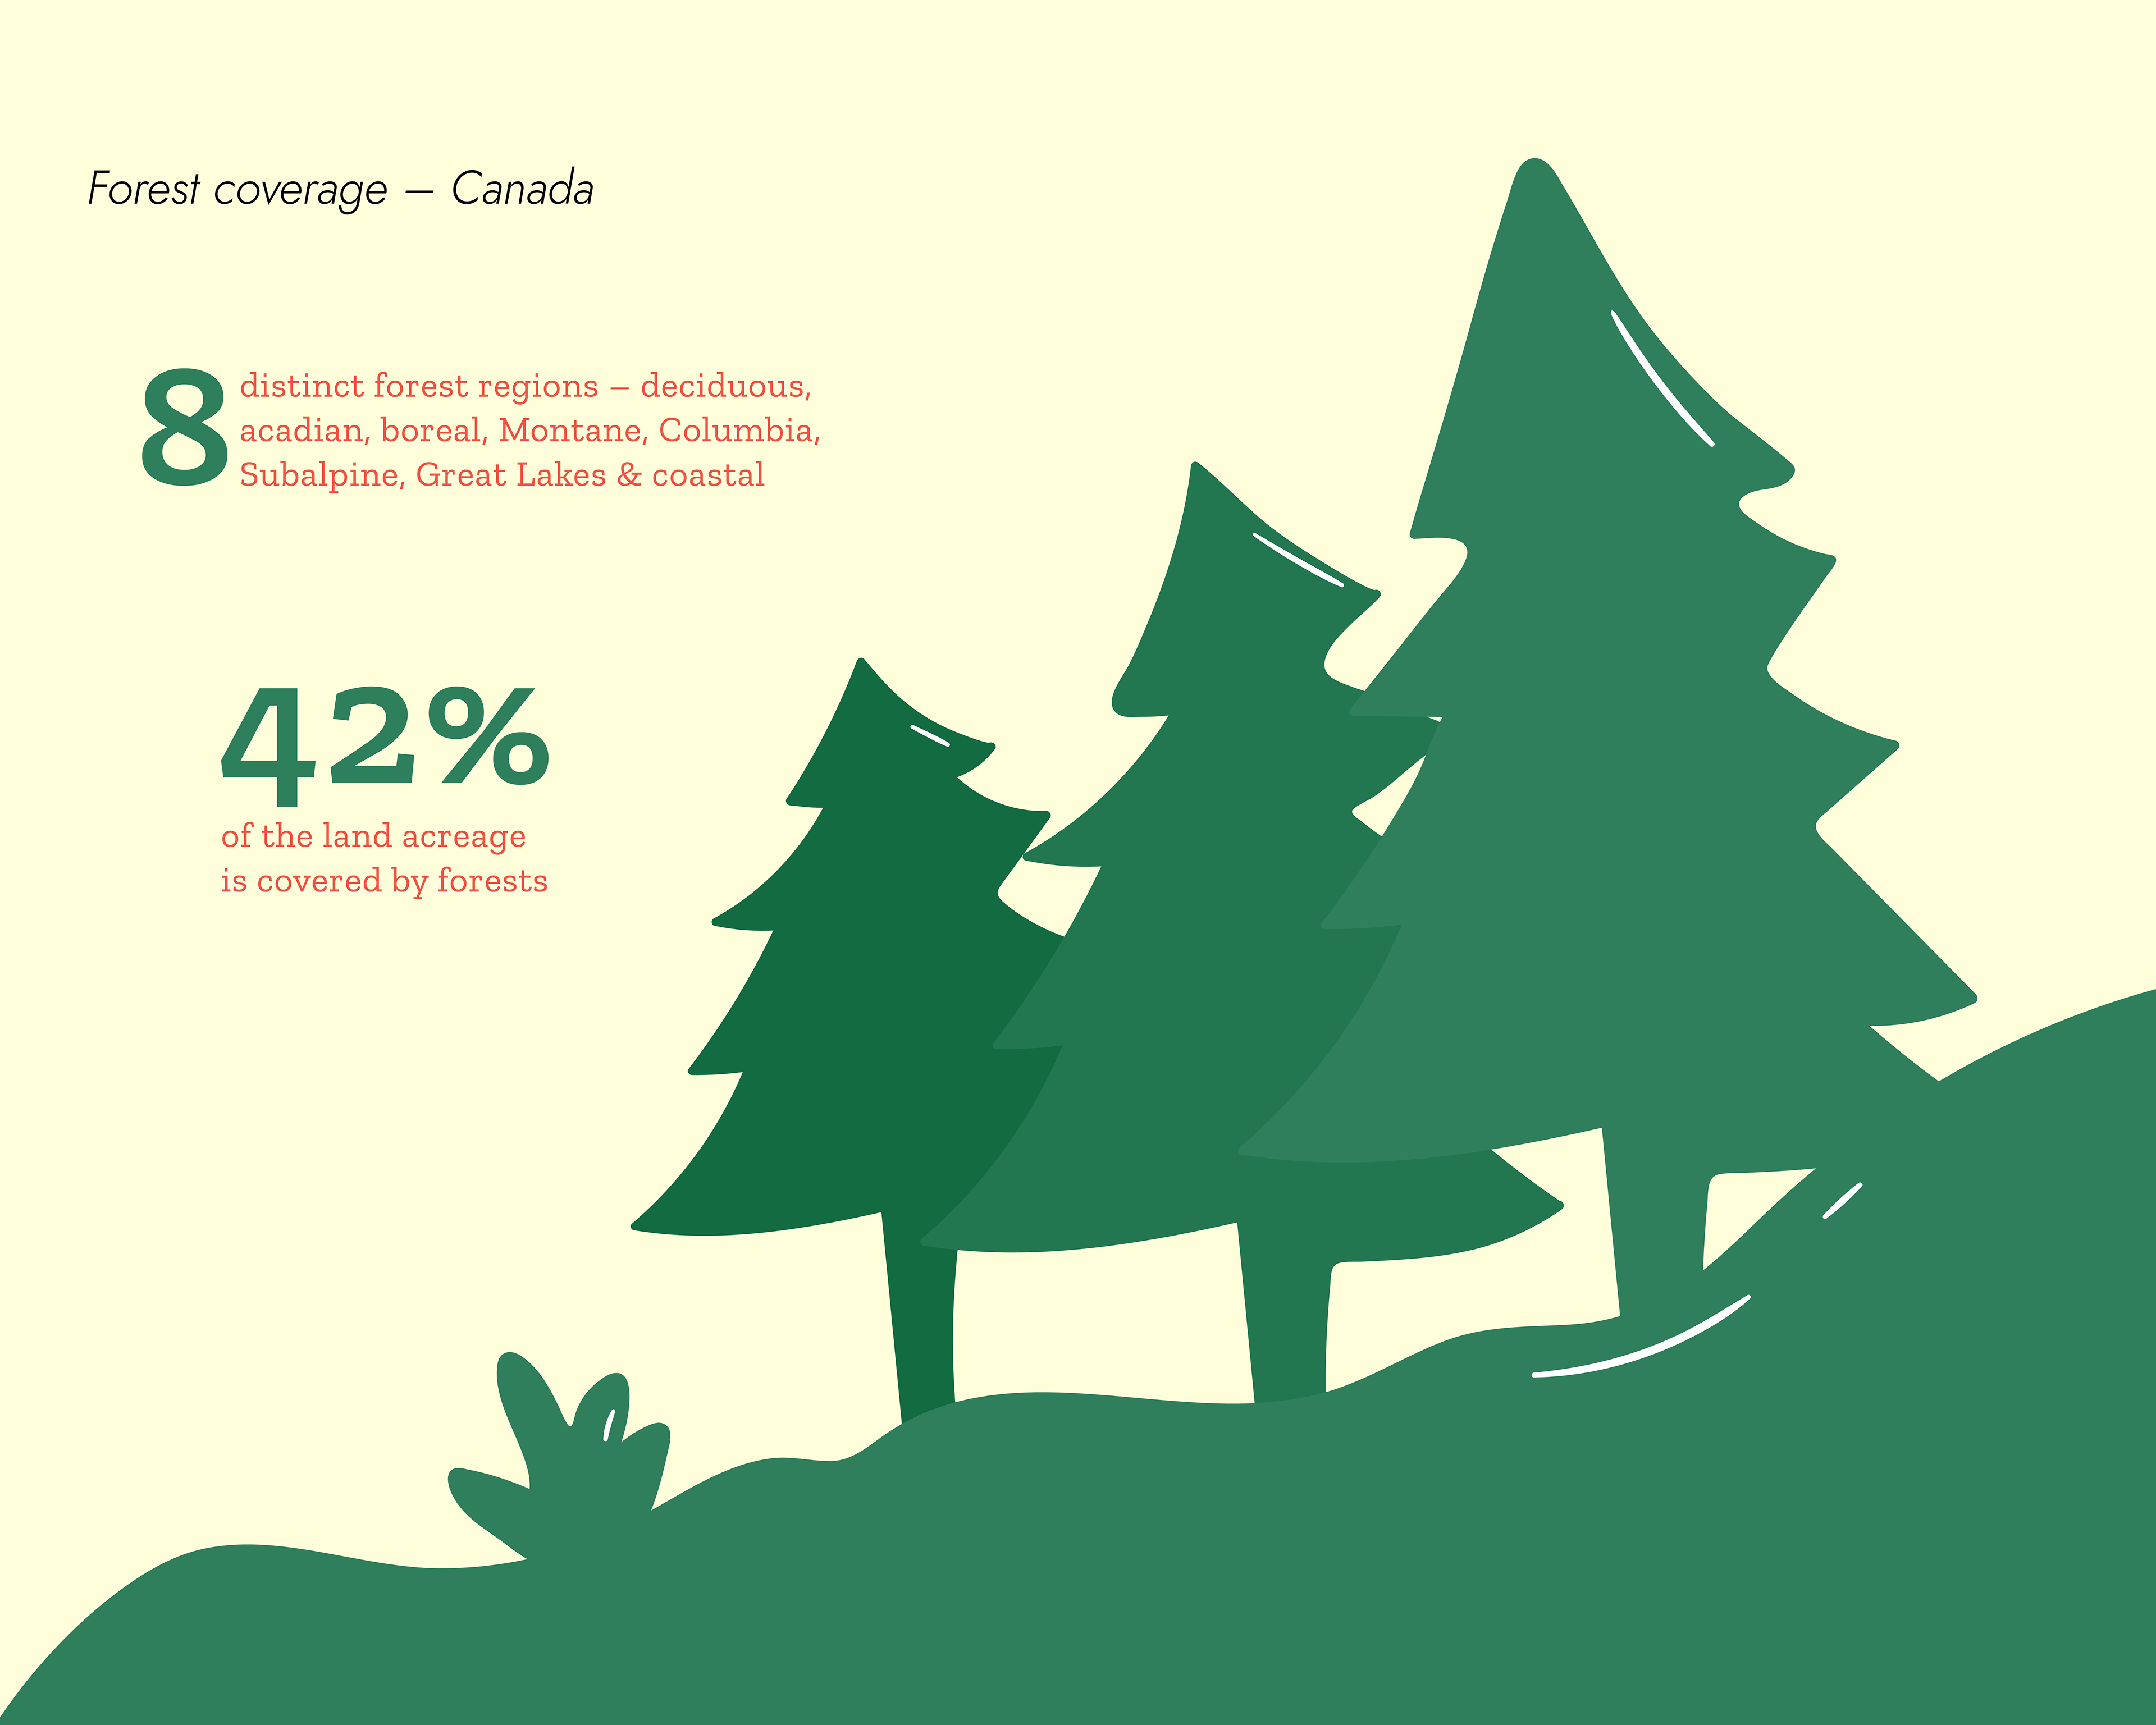
For the two countries, I chose Canada and Norway — both of which are countries that I have always wanted to visit. I decided to look into their basic information and then narrow in on natural factors such as climatic conditions, landscapes, waterbodies and the kind of wildlife that is prevalent in the countries.
For the two countries, I chose Canada and Norway — both of which are countries that I have always wanted to visit. I decided to look into their basic information and then narrow in on natural factors such as climatic conditions, landscapes, waterbodies and the kind of wildlife that is prevalent in the countries.
The idea was to provide a general overview of the theme taken for the two countries and lay it out in a comparative way that allows viewers to be able to either draw the connections or see the differences between them.
Used
Adobe Illustrator | Adobe InDesign | Wacom Tablet
Adobe Illustrator | Adobe InDesign | Wacom Tablet
Roles
Research | Sorting of Information | Writing | Illustration | Creation and Collection of Icons | Graphic Design
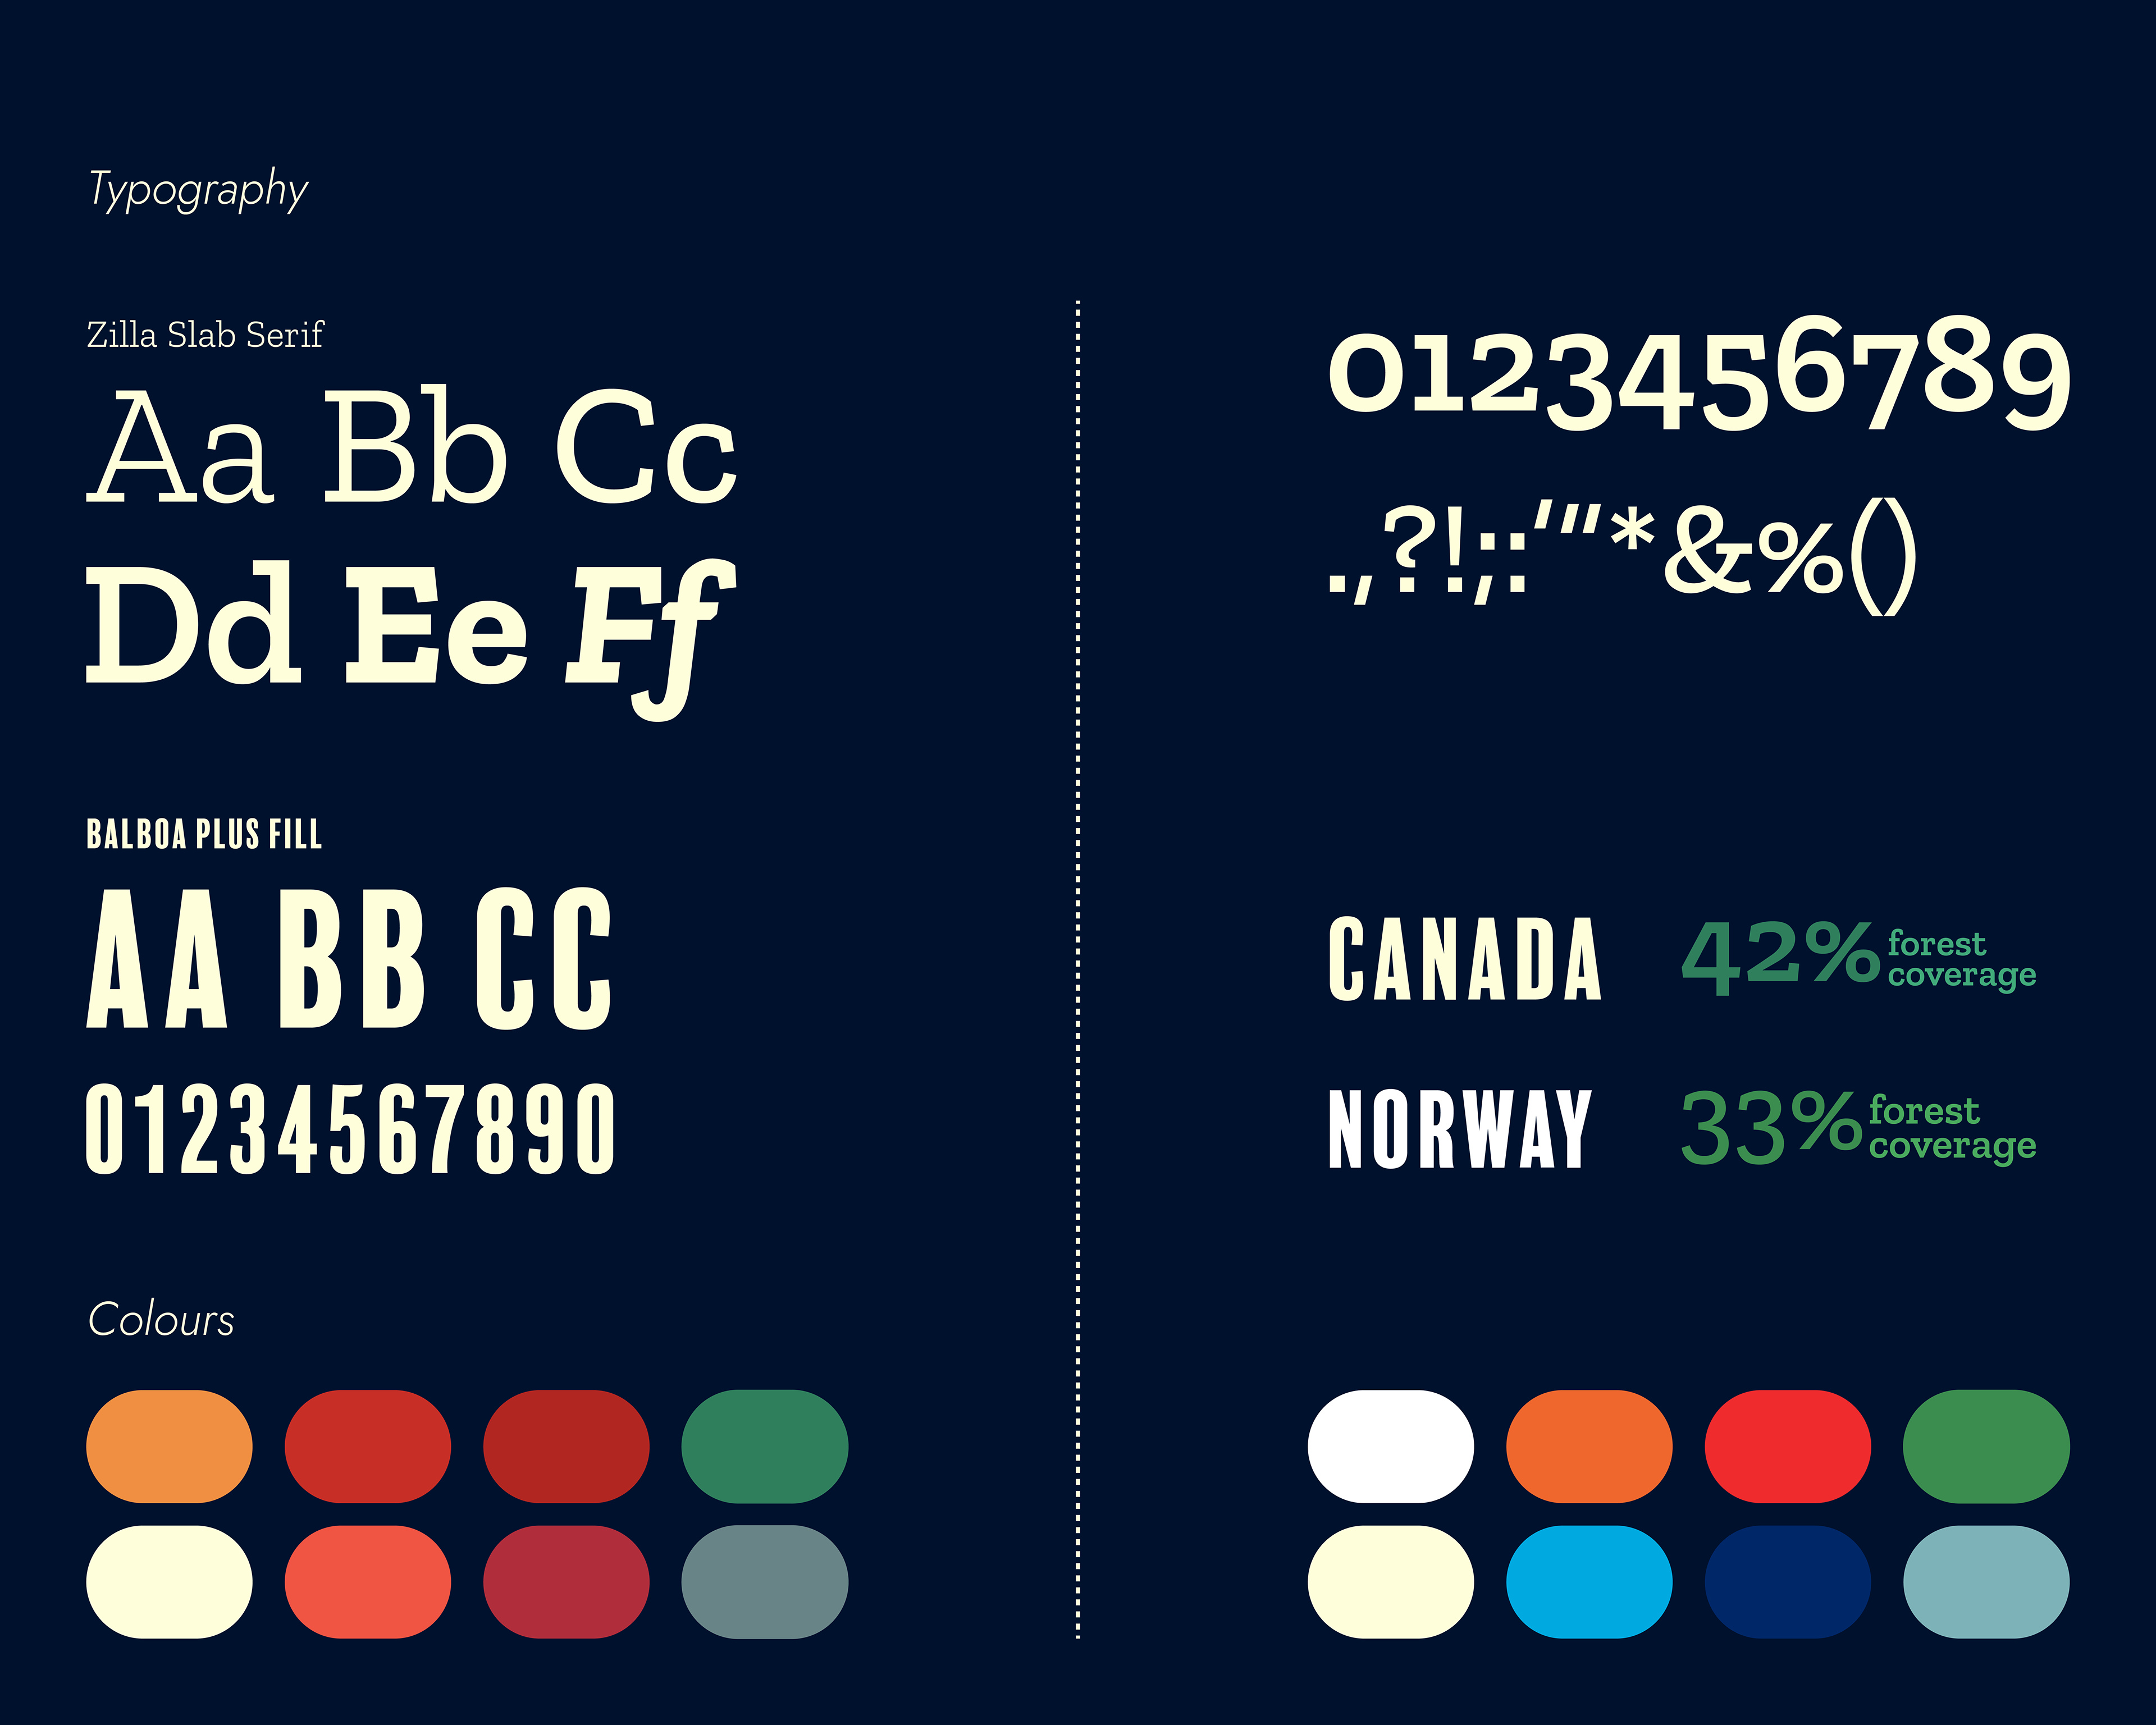
The typography and colours used in the design of the infographic — I incorporated the colours from the flags of both countries into their different palettes. The colour palette on the left was used for Canada's part and the palette on the right was used for the Norway's part of the infographic.
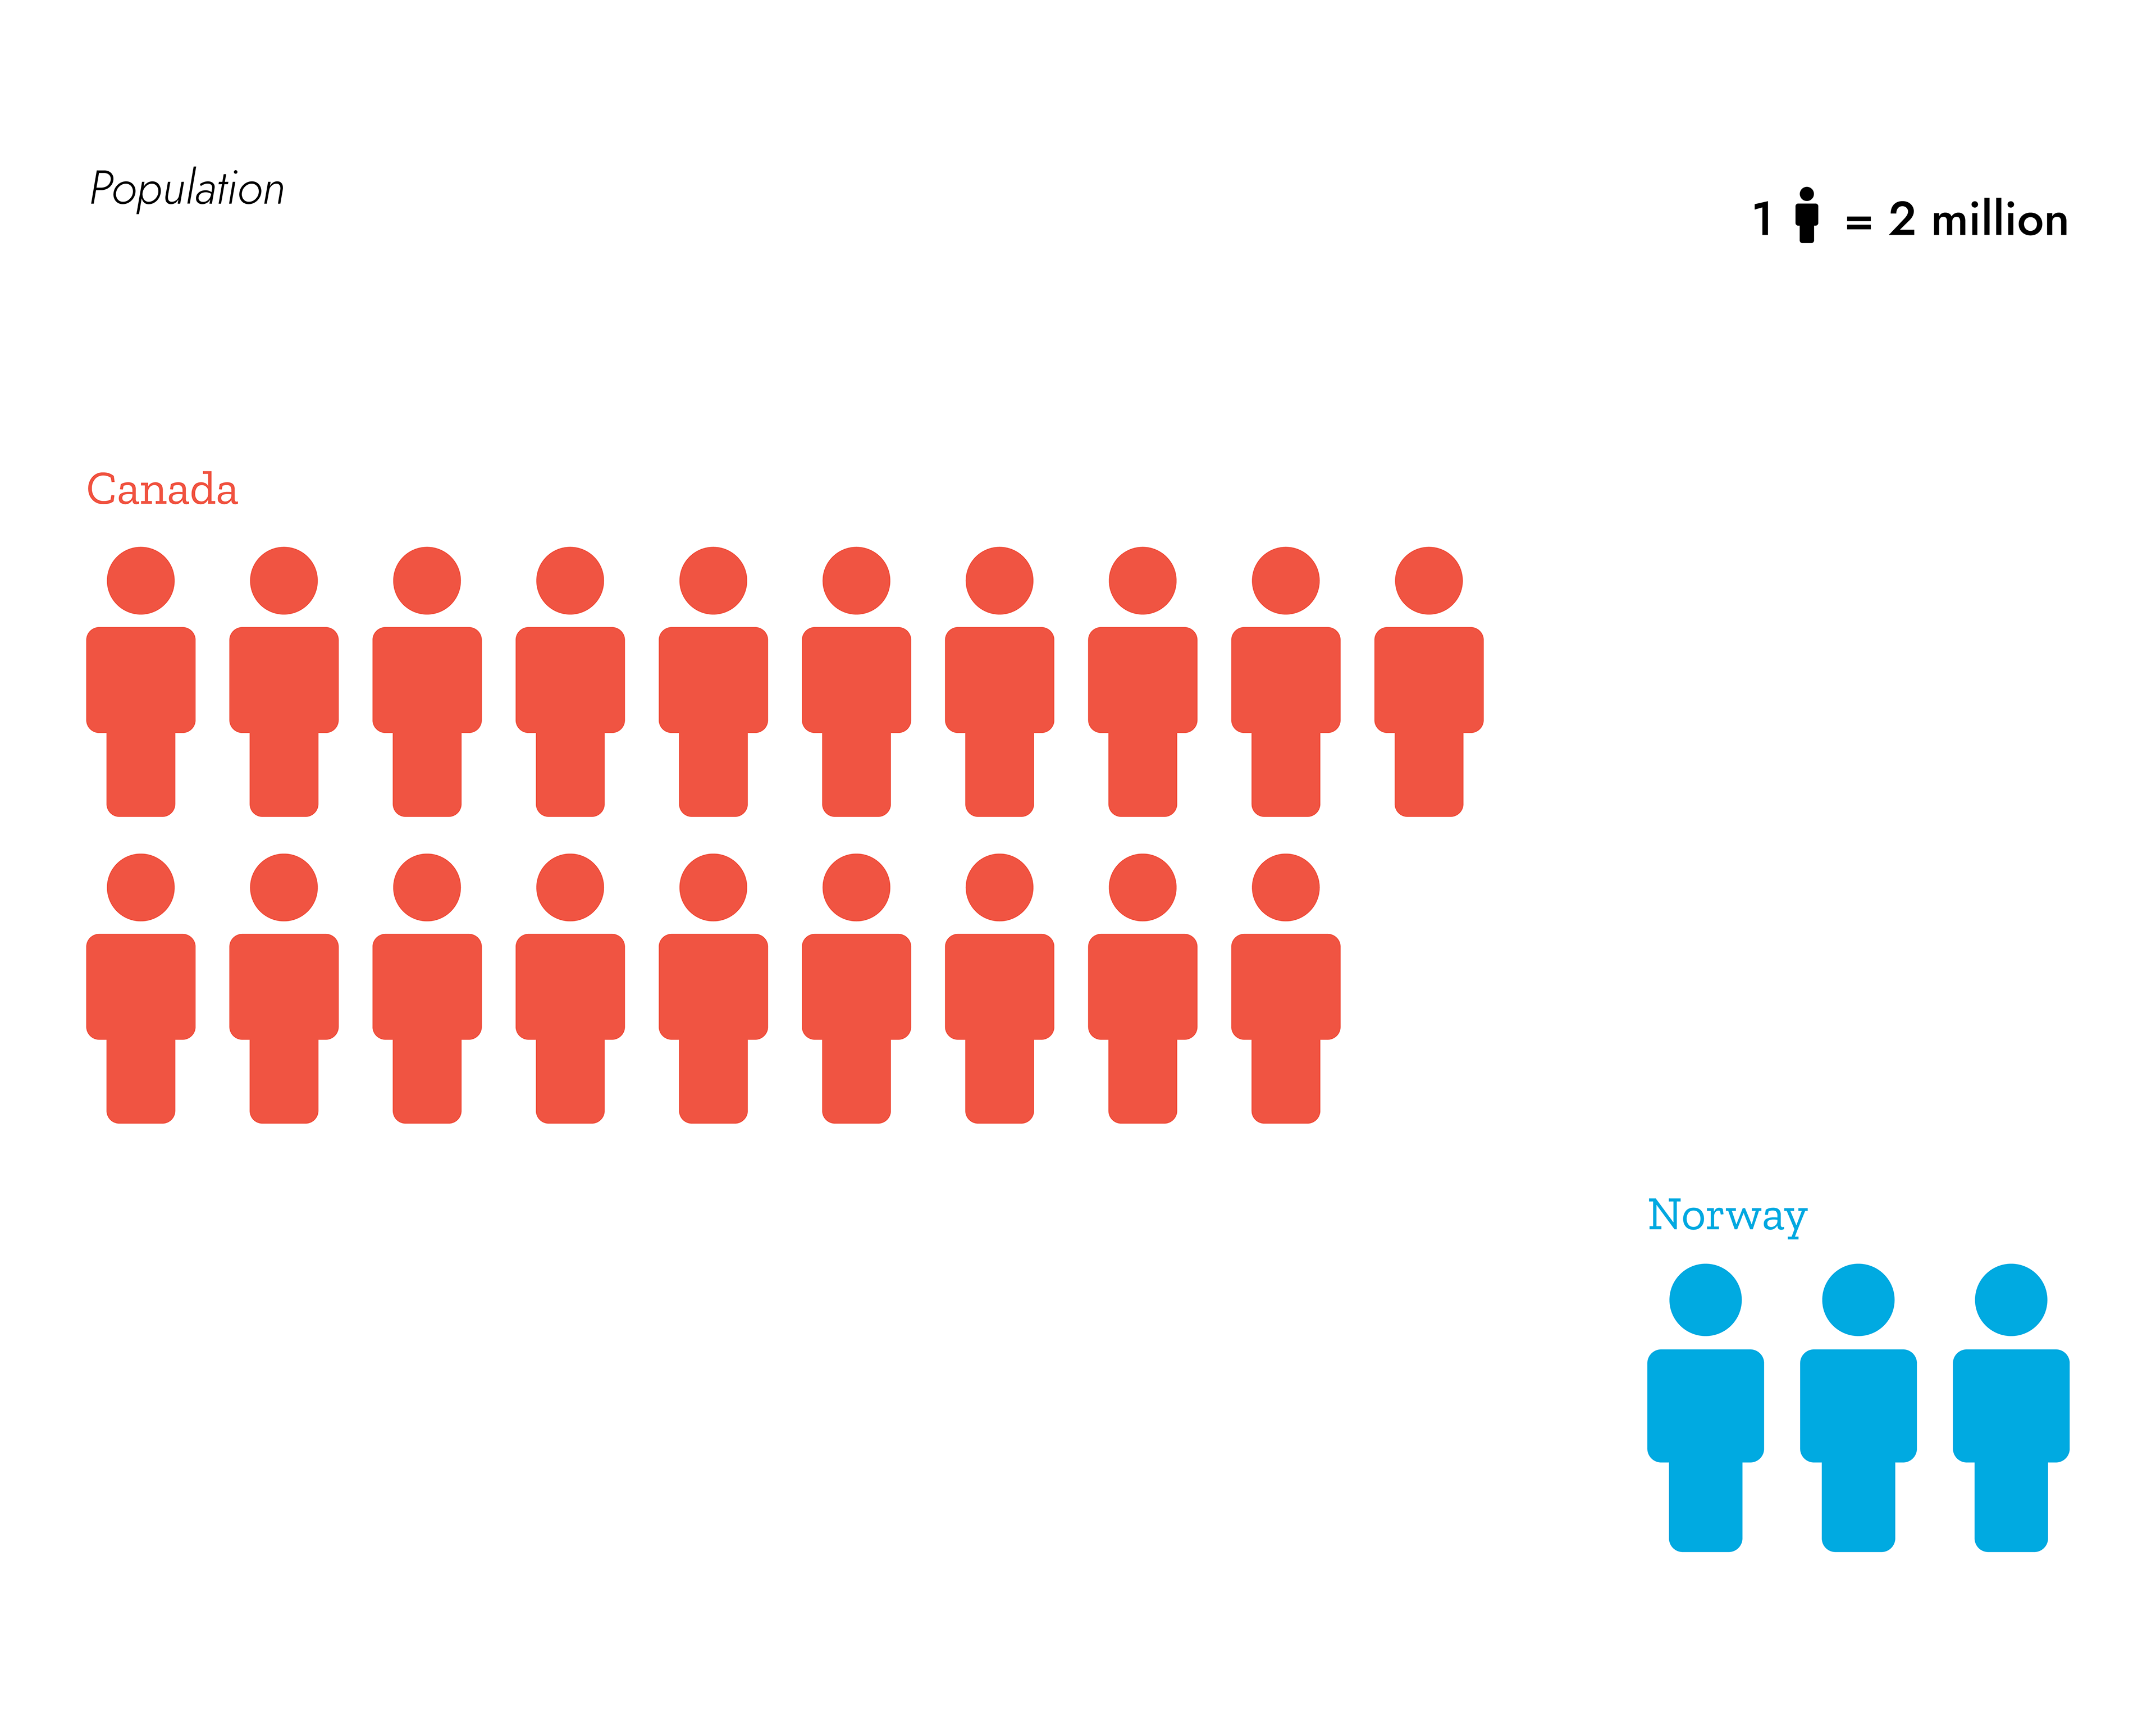
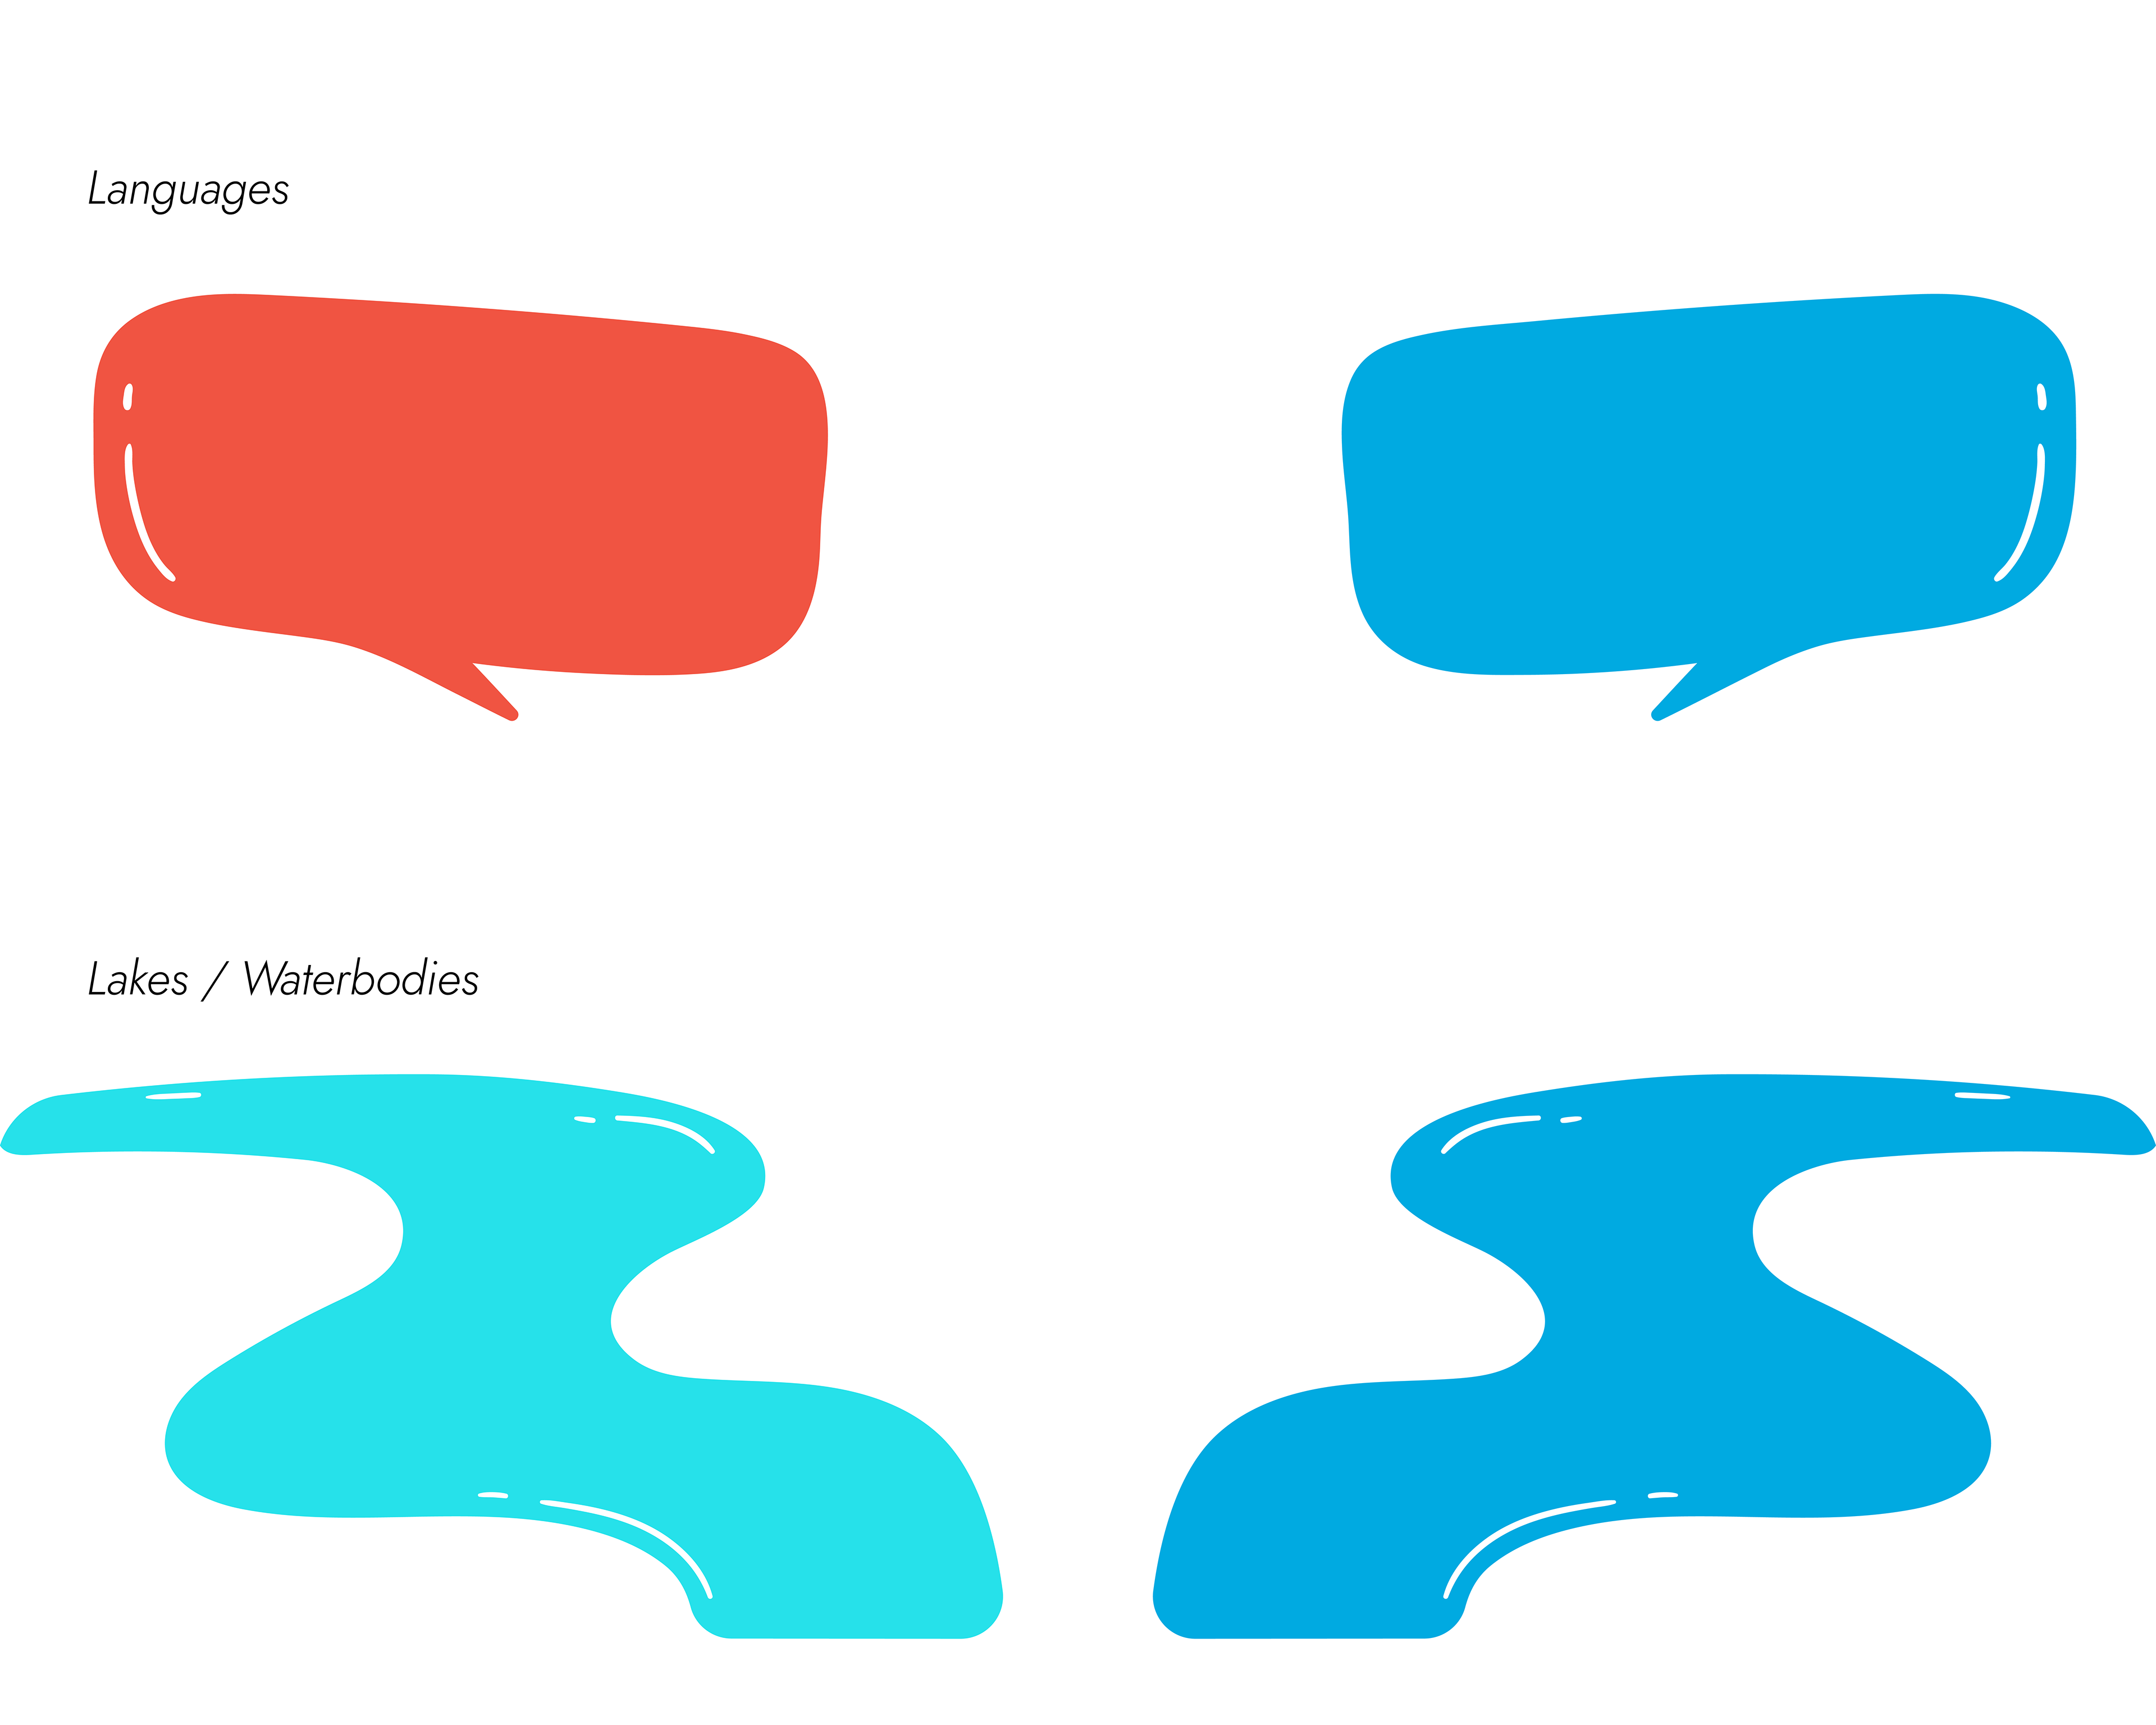
A breakup of the different elements and information bits that were used in creating the final comparative infographic on Canada & Norway.
The final infographic that was designed after collecting, sorting the information and creating visual elements to bring out the different information.
Visualising the comparative infographic as printed material for a magazine/book etc.
Thank you. Hope you enjoyed this project!